Mike Sounds Off on Bonds
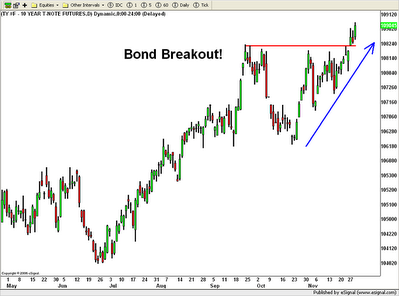
 With the chart, he included this note ...
Folks – The entire bond market is breaking out on big volume today. This is just the 10-year note chart, on which you can see a clear breakout above the 108 20/32 level. Long bonds have a similar chart pattern. On a yield basis, 10-year yields have broken through critical resistance (to the downside) at 4.54% … and are even below 4.5% now. The catalyst was a weak Chicago PMI report. ALSO, the HGX index of leading home building stocks is testing/breaking through the 200-day moving average due to the fact that rates are falling fast enough to actually give some support to mortgage demand.
I have NOT been adding any new home builder shorts for a while due to the technical strength. I have also refrained from shorting bonds and have specifically NOT advocated doing so... [you may] believe that inflation matters to bond traders … that rising oil and gas price are inflationary … that all this easy money will drive up rates … or that a dollar plunge will result in overseas holders dumping bonds, those forces are NOT what are driving the bond market. It is the ECONOMIC outlook. And right now, it stinks.
At some point, maybe people will care. But they don’t yet, and they haven’t for a while (as proven by the five-month, 6-point rally in 10-year prices). I just thought everyone should be aware about this key technical action and its potential implications. Thanks.
Pretty interesting stuff, eh? Is he right? We'll find out -- I tend to be more bullish on the economy than he is. But it's a good reality check to get opinions from people who don't agree with you all the time (if only the insane clown posse in Washington D.C. tried that once in a while). You can read more on Mike's blog at Interest Rate Roundup
Labels: bonds, GDP, interest rates


<< Home