The Most Bullish Silver Chart You've Seen in a Long, Long Time
Silver is in serious breakout mode. Look at this chart of silver and I'll explain why...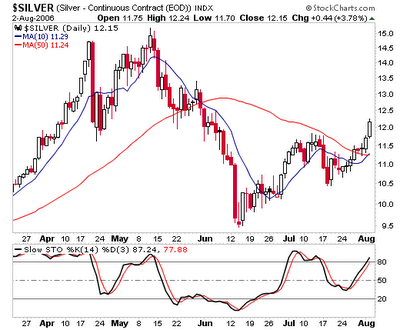 #1) Price action. You can see that silver pushed above overhead resistance at about $11.70.
#2) The uptrend. It is strong and supportive
#3) Moving averages. Speaking of support, you can see that silver's 10 and 50-day moving averages are both under it, lending support.
#4) Momentum. The stochastics indicator ont he bottom of the chart made a higher low and is is in "breakout" mode right now.
#5) Inverted head and shoulders. Turn on your side and rest your head on your desk as you look at the monitor -- I want to show you something. And that is that you look darned silly lying sideways on your desk. Seriously, use your ruler to draw a line between the intraday peaks on May 17 and July 17. Now extend that line in both directions. You've just drawn a chart that shows an inverted head and shoulders, which is bullish enough to bring us to $13.50. But I believe we're going much higher.
I keep hammering away about silver's fundamentals. Looks like the market might be catching up with them.
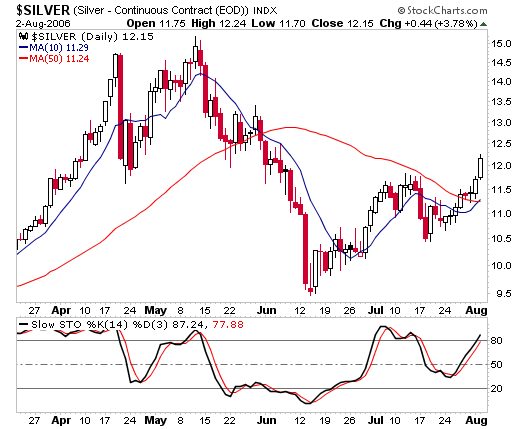 #1) Price action. You can see that silver pushed above overhead resistance at about $11.70.
#2) The uptrend. It is strong and supportive
#3) Moving averages. Speaking of support, you can see that silver's 10 and 50-day moving averages are both under it, lending support.
#4) Momentum. The stochastics indicator ont he bottom of the chart made a higher low and is is in "breakout" mode right now.
#5) Inverted head and shoulders. Turn on your side and rest your head on your desk as you look at the monitor -- I want to show you something. And that is that you look darned silly lying sideways on your desk. Seriously, use your ruler to draw a line between the intraday peaks on May 17 and July 17. Now extend that line in both directions. You've just drawn a chart that shows an inverted head and shoulders, which is bullish enough to bring us to $13.50. But I believe we're going much higher.
I keep hammering away about silver's fundamentals. Looks like the market might be catching up with them.
Check out my new gold and energy blog at MoneyAndMarkets.com
posted by Sean Brodrick @ 1:47 AM
![]()


<< Home