Gold: Where to now?
We got the big pullback in silver (and gold) that I was looking for, and now where are we? Is this bounce the bottom?Oh, I would so like it to be. But I think we're in for a bounce and another leg down.
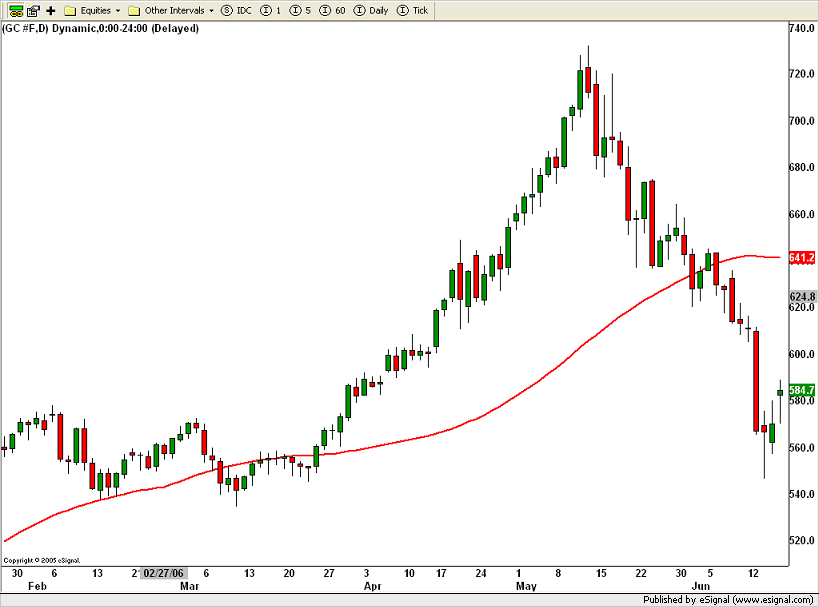
First, let's look at a chart of gold...
 Looking at the chart, we can see that it came down to test long-term support and tested it succesfully. This is very, very good if you're a bull. I could show you another chart that illustrates that an even-longer-term uptrend for gold hasn't even been tested yet.
On the not-so-good side, it would be very unlikely to see a sucessfully V-shaped recovery after such a sell-off. It's more likely that gold is forming a "bear flag," which can take up to 2 weeks to form. It will likely get up to the 608 level. It may even get as high as the 50-day moving average (the blue line on the chart), around 640. This happens for various technical reasons, but the primary reason being that the cruel market gods seem to delight in continually raising our hopes only to shatter them again.
The third leg down could go lower than 540, perhaps as low as 533 or 517 (there is other long-term support there). Or it could just make another trip to 540 and bounce again.
Is this bounce we're seeing now playable? Perhaps -- with the right instruments. But oh, you have to be ever-so-quick, unless you have a really long-term view and a stomach for risk.
What is likely to be the thing that caps the short-term rally in gold? To understand that, we have to look at the technical action in the U.S. dollar ...
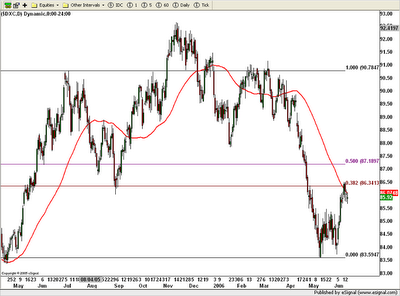 This chart shows the US dollar cash index overlaid with the 50-day moving average (the red line) and some common retracement levels. Very simply...
1) Gold and the Greenback are on what I like to call "The See-Saw of Pain." Because gold is priced in dollars, when the dollar goes up, gold USUALLY (not always) goes down.
2) This chart shows the U.S. dollar formed what is called a "head-and-shoulders" formation, which is very bearish. It broke down from that formation and went to lows established in May of last year.
3) Then the dollar bounced. This is one of the major factors in gold's recent sharp correction. But the dollar ran into trouble where the 38% retracement (another common retracement level) intersects the 50-day moving average (the red curvy line).
4) The dollar is now pulling back, and that sends gold higher. But it would not be unusual for the dollar to take another leg higher to its 50% retracement (note that is NOT the 50-day moving average -- the 50% RETRACEMENT is the horizontal purple line across the middle of the chart). This would send gold lower. And just when everyone turns bearish on gold, the dollar will bang its head on its 50% retracement and head lover.
5) The way I see it, the long-term fundamentals are very bearish for the US dollar and very bullish for gold. The dollar's bounce is just that -- a bounce in a longer-term downtrend. The recent pullback in gold is just that -- a pullback in a longer-term uptrend.
That is how I am going to play metals from here.
Check out my new gold and energy blog at MoneyAndMarkets.com
posted by Sean Brodrick @ 7:53 AM
![]()


<< Home