Amazing Chart on Oil
 Source: http://www.mylinuxisp.com/~blawrence/world-overview0.jpg
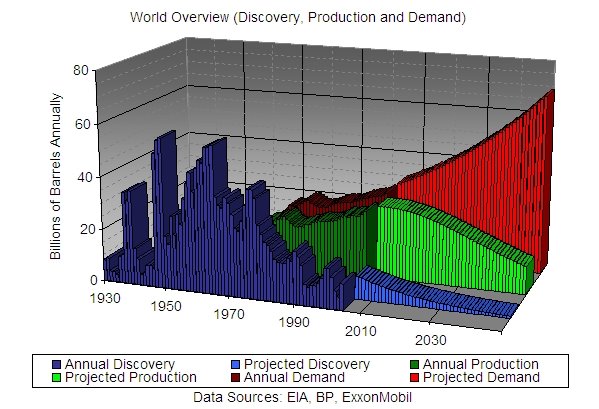
I am not particularly bullish on oil in the short term, but long-term, man oh man, is this chart bullish!
By the way, According to EIA year-on-year production has dropped - 84,105 in March 2005 versus 84,047 March 2006. Now, taken along with the fact that Iran has to store oil it can't sell, maybe we DO have a short-term oversupply of oil on the market. I'll watch for further developments.
Check out my new gold and energy blog at MoneyAndMarkets.com
posted by Sean Brodrick @ 4:40 PM
![]()


<< Home