Monday Is Chart Day
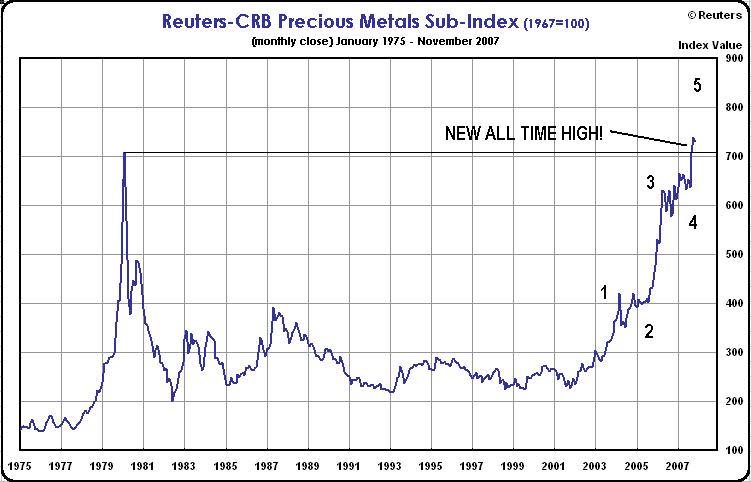
Here is a chart from Seeking Alpha today …
 Now, let's look at a weekly chart of the S&P TSX Composite ...

And now, let's look at a weekly chart of the HUI Gold Bugs Index (a basket of leading gold stocks) divided by the price of gold. When gold stocks are cheap relative to the price of gold, this indicator should be at the bottom of the price channel …
 Now, let's look at a weekly chart of the S&P TSX Composite ...
And now, let's look at a weekly chart of the HUI Gold Bugs Index (a basket of leading gold stocks) divided by the price of gold. When gold stocks are cheap relative to the price of gold, this indicator should be at the bottom of the price channel …

It looks like the big-name gold stocks are going to get CHEAPER relative to gold. I think the price of gold is going to rise while gold stocks stay flat to down. This is the pattern we’ve seen in the last couple months, as gold miners underperform gold itself.
The exception will likely be gold miners that can strictly control costs and/or that are already undervalued.
Check out my new gold and energy blog at MoneyAndMarkets.com


<< Home